This website showcases results and images from a joint study of the Carte Pisane carried out by the
BnF and the
C2RMF in which pigment analysis, carbon dating and hyperspectral imaging was carried out.
Pigment Analysis and Carbon 14 Dating
Pigment analysis was carried out by the conservation department at the BnF using XRF and Scanning Electron Microscopy. The analysis report can be downloaded
here.
Carbon 14 dating was also carried out at the C2RMF and the report can be downloaded
here.
Hyperspectral Imaging
Acquisition
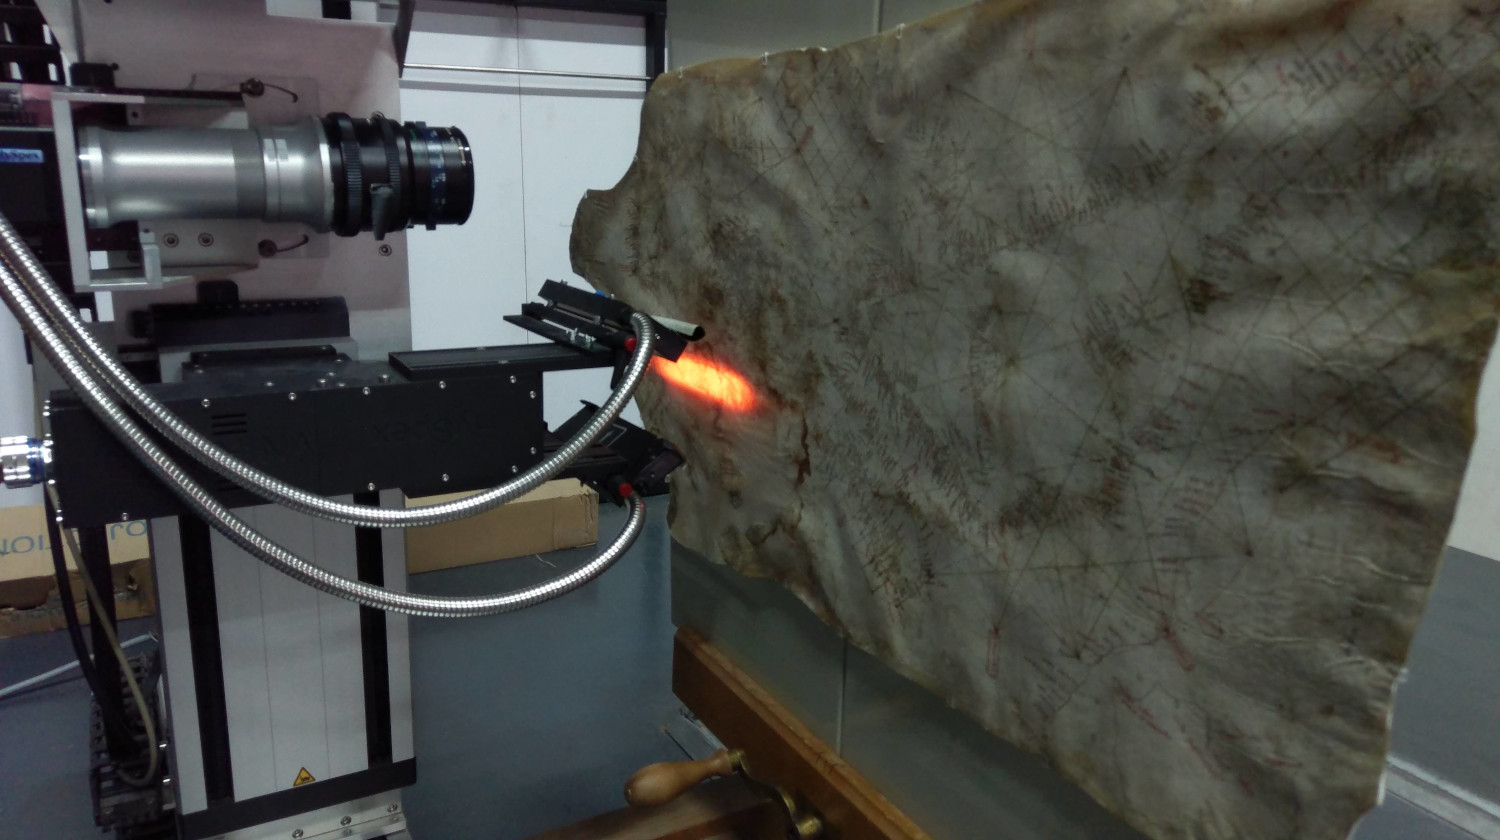
Pushbroom hyperspectral camera at the C2RMF scanning a line on the Carte Pisane
Hyperspectral imaging of the Carte Pisane was carried out at the
C2RMF. Images were acquired using a pushbroom hyperspectral camera mounted on an motorized XY frame capable of acquiring spectral data in the visible - near infrared range of 400-1000nm. 18 scans were acquired over different regions in order to acquire the entire surface of the map at a resolution of 15 pixels/mm. The data was calibrated using the principles described in
(Pillay et al 2019) and assembled into a fully calibrated high resolution mosaic. The final spatial size of the assembled hyperspectral data is 17726 x 8472 pixels with 40 spectral channels per pixel. The final spectral image file has a total size of around 12GB.
A second full acquisition was carried out using raking light, allowing a surface topology to be extracted and made visible through a shading map. This acquisition was carried out using the same method as above with the same acquisition characteristics.
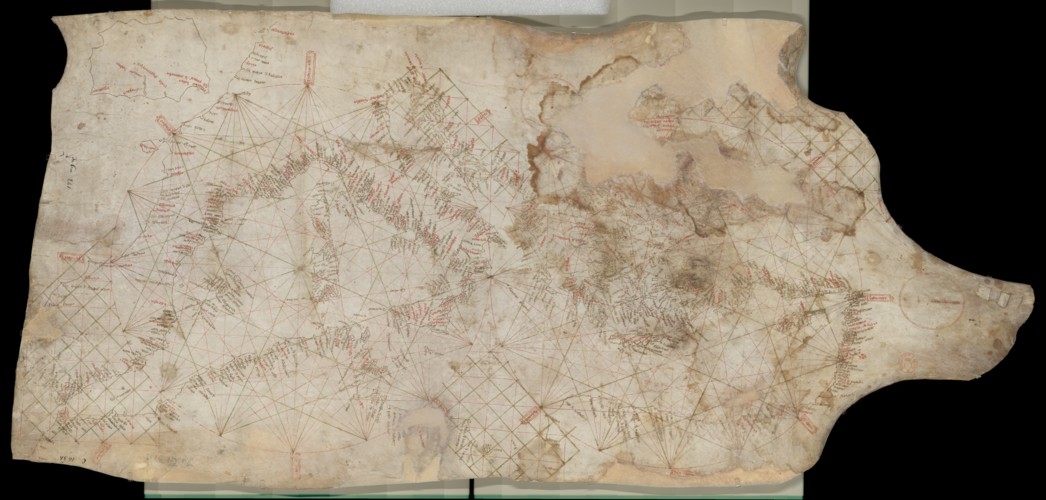
A number of images were created from this spectral image. Firstly, a fully calibrated colorimetric image was created with color values calculated directly from the specttra at each point. This gives accurate CIELAB color values at each pixel with the view provided below rendered using a D65 illuminant. Principal component analysis was also calculated from the spectral image as well a false color view using PCA bands 2, 3 and 4.
Results
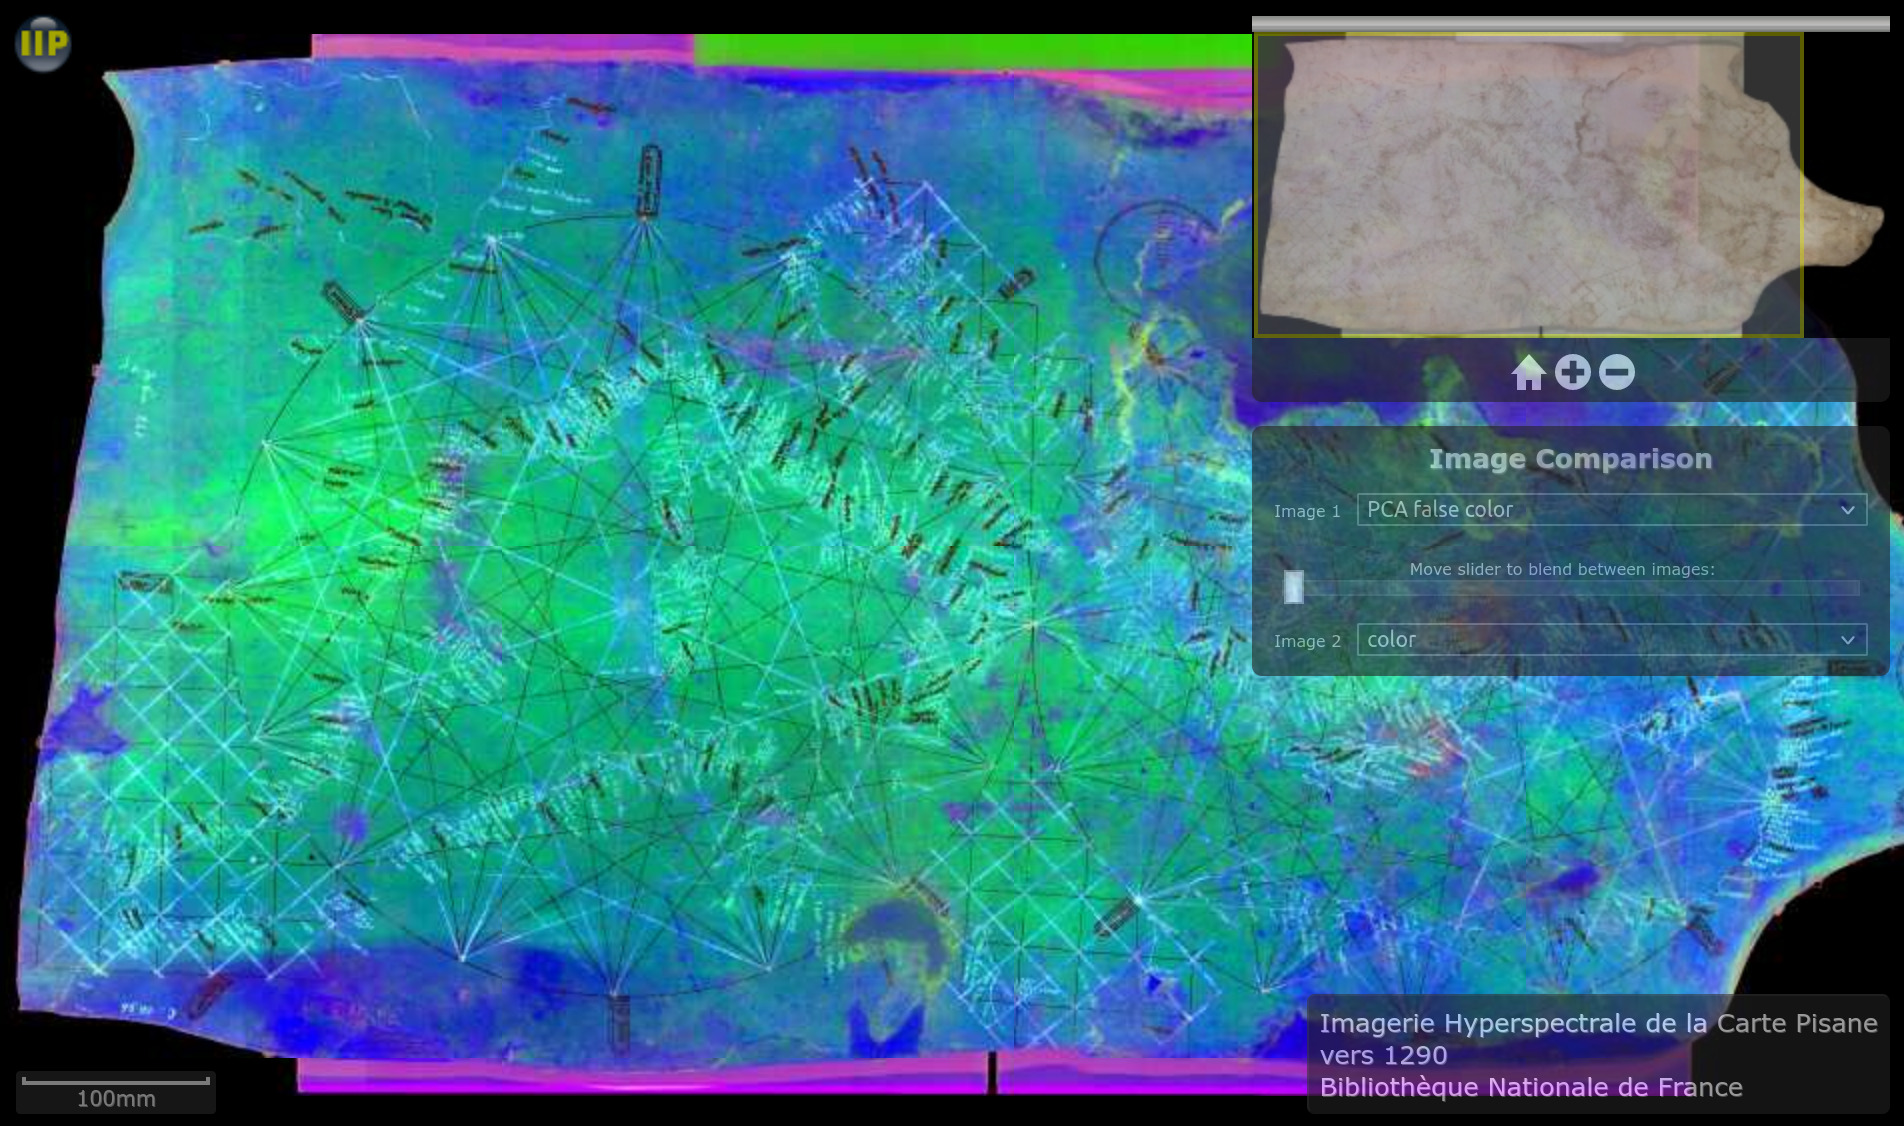
Interactive viewer displaying color and PCA false color images
Click to open interactive viewer. The viewer is based on the
IIPImage visualization software and allows you to pan and zoom within the full resolution hyperspectral data and select various views of the data. These views include the fully calibrated color image, various spectral bands (near the UV region at 414nm and in the near infrared at 992nm), the first four principal component analysis bands, a false color view created from PCA bands 2, 3 and 4. Finally, the surface shading map can be viewed. Each of these images can be selected and compared with any other by means of superposition and the ability to blend between any 2 images via the slider.